The Saman Group launched a new smart home battery. This product allows you to store power from your solar panels and save money through a smart system.
While the smart home battery is a great product, explaining how it can save you money seems complicated at first glance. That's why the Saman Group wanted to make the explanation visual, making it easier to understand.
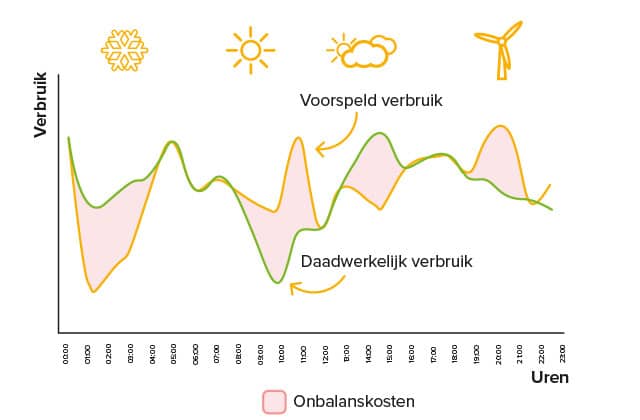
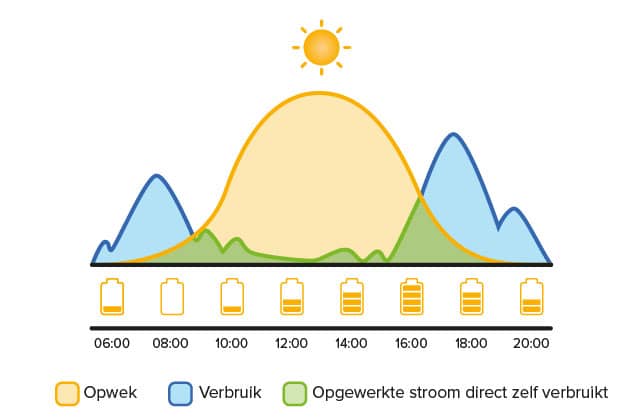
I primarily used graphs to illustrate this. The challenge was to clearly present all the information in a few graphs. To achieve this, I used different colors to distinguish the various phases. To keep it in line with the Saman Group's style, I applied their corporate colors so it complemented the website.


Get in touch! We can brainstorm together to see how we can solve your problems with graphic design.